Retail Conversational Intent Data: What Customer Conversations Mean for Retailers
December 22, 2021


Knowing that there’s been an increase in customer conversations with your company doesn’t provide insight into a customer’s mindset – it’s only half the battle. You need to know what they’re actually saying (customer intent data) in order to deliver great customer experiences.
Each quarter we look at data from the Conversocial, A Verint Company, platform to analyze the different trends across a number of industries. We aim to offer insight into the shift towards digital customer conversations and how brands can anticipate surges or recognize patterns in consumer habits that will help them create better experiences, leading to a happier customer and longer-lasting relationships.
Firstly we are looking at retailers, but going a little further back than Q2 of 2021. It’s been a crazy 12+ months for the whole world, but retailers have had to adapt their business models as much as anyone.
It’s important to not lump all retailers together. Therefore we divided between food and non-food retailers because while the data from both tells a story of far more digital engagement, the patterns from each are very different. They highlight the changing pressures on each and different challenges both have had to face since March 202
This Quarter’s Top Retail Intents
Food Retailers
- Delivery and Orders
Non-Food Retailers
- Delivery and Orders
- Damaged Orders
Food Retailers
Intent: All (Nov 2019 – May 2021)
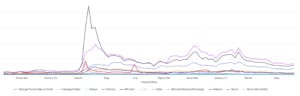
After an initial spike in March 2020, volume settled but remained 3x higher
The constant of any graph we see from the volume surges that hit our partners over the past 18 months is that huge K2-esque spike in March 2020. The key is to take a deeper look at what the biggest spikes were, and if it was an understandable one-off or a precursor to a shift in consumer behavior.
If we look at the graph above, the biggest growth in volume came from “Delivery”, “Order” and “Refunds, Warranty and Exchange” which grew in March and April, but then remained far higher than pre-pandemic levels. There were significant spikes in stock queries and store information requests, but they were short-lived and were back to far more manageable levels by September/October 2020. Let’s have a closer look at what those different intents tell us about shifting consumer habits.
Intents: Delivery (black line) and Order (purple line)
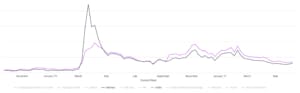
Delivery and order intents provided by far the biggest volume of customer conversations
These were the two biggest intents that have driven volume for food retailers across the whole pandemic, with the largest growth obviously coming at the beginning. With people worried about physically going to a store and the demand for deliveries and orders at unprecedented levels and nowhere near enough slots or delivery drivers available, the surge in customer queries is inevitable. The circumstances and solutions surrounding that particular time have been discussed enough, what’s more interesting is when the demand leveled off, it stayed 3x higher than pre-March 2020 volume.
What It Means
It points towards a behavioral change that means food retailers must reconsider what consumers now want from their experience. What began as a necessity has become a preference. What we can see from a huge growth in meal kit subscriptions is that convenience is now a huge factor in how people choose what to eat at home.
What began as a necessity has become a preference.
In the UK, Hello Fresh grew by more than 3m customers between Q1 2020 and Q1 2021, and reported global sales up by 120%. Food retailers don’t just have to adapt a business model to reflect changing consumer habits, there are also threats to grocery chains that didn’t really exist 18 months ago. The ability to provide convenience and personalization is the biggest chance to grow and maintain a happy customer base. This may be something as simple as using messaging channels to offer same-day collection rather than waiting two days for delivery, proactive notifications across a delivery process or using a tool like Notify to set up regular push messages asking if a customer wants their ‘regular delivery’ slot before they’ve tried to book it.
Non-food Retailers
Non-food retailers had big spikes for lockdown and Christmas
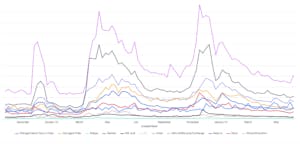
Intents: All (Nov 2019 – May 2021)
As you can see from this graph, there’s a very good reason for us separating food and non-food retailers. Their customers’ conversations both tell tales of increased query volume, but very different customer behavior and, for non-food brands, more intense periods around Christmas. Like food brands, delivery and order intents are by far the largest spikes, but whereas food retailers only really saw one initial spike before calming down, non-food saw multiple surges. It’s a more complex situation.
Intents: Deliver (black line) and Orders (purple line)
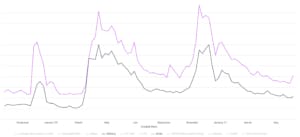
Lockdown Christmas was far busier than March’s lockdown and Christmas 2019
We can see the tell-tale March 2020 spike in both, with people unable to visit bricks and mortar shops. And much like food retailers, the volume has stayed high, but there was a secondary spike at Christmas – obviously the western world’s busiest time for eCommerce and a make or break season for many brands after a tough year. What the graph shows us is that a lockdown Christmas is busier than both a traditional Christmas and the initial lockdown volume, suggesting a pattern of busier periods than pre-pandemic levels once the world goes back to some kind of ‘normal’.
What this means
From our own research, we can see that consumer habits have changed forever. There’s been an acceleration of adopting digital practices for consumers. Private messaging on our platform alone grew 87% and nearly 70% of consumers have used a private messaging channel to engage with a brand in 2020. The average number of delivery and order intents are 70%-80% higher than pre-pandemic levels, so the huge Christmas influx is expected to be ~50% bigger as well. Research shows that 63% of delivery and order queries, or WISMO (where is my order), are actually ‘when will you ship?’ (or WWYS? if you like…) By changing your approach, and asking customers to opt-in for updates over messaging with an automated flow that integrates with your order system’s API, the biggest reason for customer contact spikes can be fully handled by service bots that operate on channels built to scale.
Intent: Damaged Order
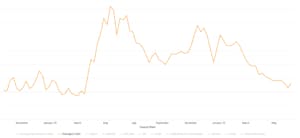
Damaged order intents took a year to return to pre-pandemic levels
This graph shows us an industry having issues coping with a larger portion of purchases now being digital rather than a mix between customers shopping in person and online. It’s a stark contrast to food retailers, who managed to get their supply chain issues under control fairly quickly after Covid hit in March, but the increase in damaged order queries took nearly 12 months to calm down for non-food retailers.
What it means
It shows supply chain issues can take a long time to get under control. This particular graph shows businesses struggling to deliver items safely during a time of unprecedented demand, but the pattern with stock or returns queries follows a very similar path. Damaged orders have been a symptom rather than a cause of the problems in supply chains.
These issues could come from higher demand leading to a lack of stock and delayed delivery – something that cost Peloton $100m – or problems with logistics such as being able to fill the increased number of orders. Whatever the cause and outcome, supply chains are expensive and complicated to fix, so dealing with them efficiently and in a single conversation is crucial for customer retention. Automated flows to deal with sending a replacement without the need for agent intervention can relieve the pressure on contact centers, as can deploying a service bot that collects all the relevant information before handing over to a human by making the process more efficient.
Often it’s not a problem with an order that can make a customer jump ship, it’s how the brand deals with the aftermath which can lead to a churn.